Understanding your Body Mass Index is crucial for assessing your overall health. A BMI chart is a simple tool that helps you determine whether your weight is in a healthy range for your height.
Using a BMI chart for women or BMI chart for men, you can easily calculate your BMI and understand what it means for your health. This calculation is a widely used method to assess weight status and potential health risks associated with it.
Key Takeaways
- Understanding BMI helps assess overall health.
- A BMI chart is a simple tool to determine healthy weight range.
- BMI charts are available for both men and women.
- Calculating BMI can help identify potential health risks.
- Using a BMI chart is a straightforward process.
What is BMI? Understanding Body Mass Index
To grasp the significance of BMI, it’s essential to understand that it’s a calculation used to categorize individuals into various weight categories. Body Mass Index, or BMI, is a widely used metric that provides insights into whether an individual’s weight is in a healthy range for their height.
The Definition and Formula
BMI is defined as the body mass in kilograms divided by the square of the body height in meters. The formula is: BMI = kg/m2. This calculation is used globally and is applicable to both adult men and women. For instance, if a person weighs 70 kilograms and is 1.75 meters tall, their BMI would be calculated as 70 / (1.75)2, resulting in a BMI of approximately 22.9.
Understanding the BMI formula is crucial for determining whether your weight falls into the underweight, normal weight, overweight, or obese category according to the bmi chart.
History and Development of BMI
The concept of BMI was first introduced by Adolphe Quetelet, a Belgian mathematician and statistician, in the 19th century. Initially, it was termed the “Quetelet Index.” Later, in the 1970s, American physiologist Ancel Keys popularized the index and renamed it Body Mass Index (BMI). Since then, BMI has become a standard tool used by health professionals worldwide to assess weight status. Both male bmi chart and female bmi chart use this index to categorize weight.
The widespread adoption of BMI is due to its simplicity and the ease with which it can be calculated, making it a valuable tool for initial health assessments.
How to Calculate Your BMI
To determine your BMI, you need to follow a simple formula that takes into account your weight and height. This calculation is useful for both men and women, providing insights into their weight status using a bmi chart.
The Standard BMI Formula
The BMI formula is calculated by dividing your weight in kilograms by your height in meters squared. The formula is: BMI = kg/m2. This formula is universally applied, making it a straightforward method for assessing weight status across different populations, including men and women who can refer to their respective bmi charts.
Metric System Calculation
If you’re using the metric system, the calculation is straightforward. For example, if you weigh 65 kilograms and are 1.72 meters tall, your BMI would be 65 / (1.72)2 = 21.97. This result can then be plotted on a women’s bmi chart or men’s bmi chart to understand your weight status.
Imperial System Calculation
For those using the imperial system, the calculation involves converting pounds to kilograms and inches to meters before applying the BMI formula. The conversion factors are: 1 pound = 0.453592 kilograms and 1 inch = 0.0254 meters. For instance, if you weigh 150 pounds and are 5’8″ (68 inches) tall, you first convert your weight and height to metric units: 150 pounds * 0.453592 = 68 kilograms and 68 inches * 0.0254 = 1.73 meters. Then, your BMI is 68 / (1.73)2 = 22.7.
Online BMI Calculators
For convenience, numerous online BMI calculators are available. These tools allow you to input your height and weight, and they calculate your BMI instantly. They often come with additional features such as categorizing your BMI into underweight, normal weight, overweight, or obese categories, and some even provide recommendations based on your result. You can find men’s bmi chart and women’s bmi chart resources online as well.
| Category | BMI Range |
|---|---|
| Underweight | Less than 18.5 |
| Normal Weight | 18.5 – 24.9 |
| Overweight | 25 – 29.9 |
| Obese | 30 or greater |
BMI Chart: Understanding the Different Categories
Understanding the different categories of the BMI chart is crucial for assessing your health status. The BMI chart is a simple yet effective tool that categorizes individuals into various groups based on their body mass index, helping determine whether their weight is in a healthy range for their height.
Underweight: BMI Below 18.5
A BMI below 18.5 is considered underweight. Being underweight can be just as harmful as being overweight, potentially leading to nutrient deficiencies, osteoporosis, and a weakened immune system. Individuals with a BMI below 18.5 may need to consult a healthcare professional to rule out any underlying health issues.
Normal Weight: BMI 18.5-24.9
A BMI between 18.5 and 24.9 is considered normal weight. This range is generally associated with the lowest risk of health problems. Maintaining a healthy lifestyle, including a balanced diet and regular exercise, is key to staying within this range.
Overweight: BMI 25-29.9
A BMI between 25 and 29.9 is classified as overweight. Being overweight increases the risk of developing conditions such as diabetes, heart disease, and certain types of cancer. Lifestyle changes, including diet and exercise, can help reduce BMI and mitigate these risks.
Obesity Classes I, II, and III
Obesity is categorized into three classes based on BMI: Class I (BMI of 30-34.9), Class II (BMI of 35-39.9), and Class III (BMI of 40 or higher). Obesity significantly increases the risk of serious health problems, including cardiovascular disease, type 2 diabetes, and certain cancers. Individuals in these categories may benefit from consulting healthcare professionals to develop a weight management plan.
Understanding these categories is essential for both men and women, as the health implications can vary. Using a BMI chart for women or a BMI chart for men can provide insights into healthy weight ranges and help individuals set realistic goals for weight management.
How to Read and Interpret a BMI Chart
Reading a BMI chart can seem daunting, but it’s a straightforward process. Understanding how to interpret the chart is crucial for assessing your health and making informed decisions about your weight.
Finding Your Height and Weight
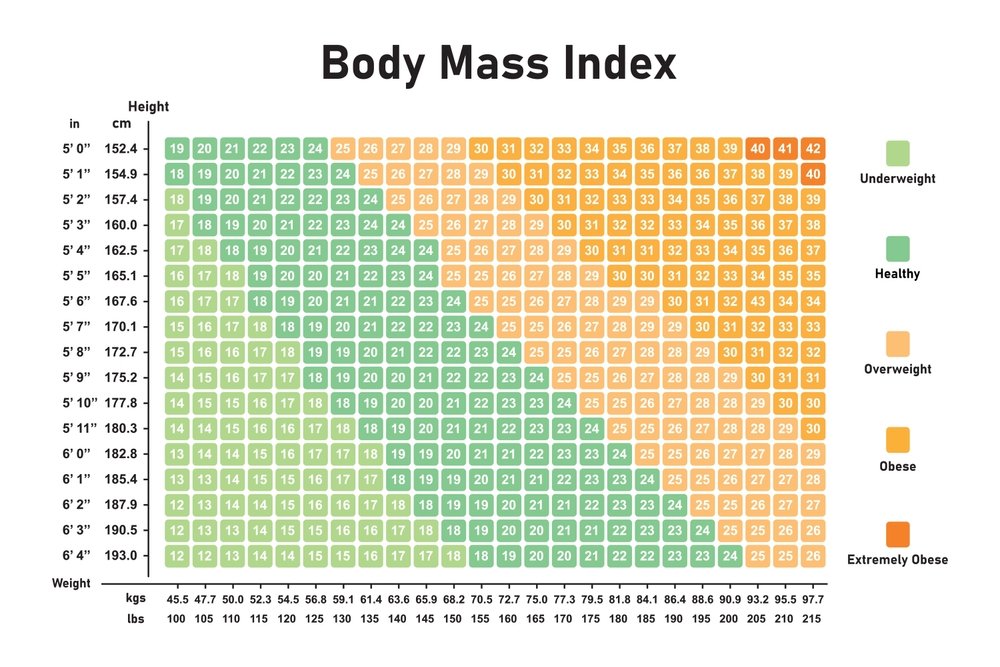
The first step in using a BMI chart is to locate your height and weight on the chart. Most BMI charts are grid-based, with height on one axis and weight on the other. To find your BMI, you’ll need to know your height in inches or meters and your weight in pounds or kilograms. For example, if you’re 5’8″ (172 cm) and weigh 150 lbs (68 kg), you’ll find your height on the chart and then move across to your weight.
Identifying Your BMI Range
Once you’ve located your height and weight on the chart, you can identify your BMI range. BMI charts typically categorize BMI into several ranges, including underweight, normal weight, overweight, and obese. Understanding which category you fall into can help you assess your health risks and make necessary lifestyle changes. For instance, a BMI between 18.5 and 24.9 is generally considered normal weight.
Color Coding and Visual Elements
Many BMI charts use color coding and visual elements to make it easier to understand your BMI range. For example, a chart might use green for normal weight, yellow for overweight, and red for obese. These visual cues can help you quickly identify your BMI category and understand the associated health risks.
Tracking Changes Over Time
One of the most valuable aspects of a BMI chart is its ability to help you track changes in your BMI over time. By regularly plotting your height and weight on the chart, you can monitor your progress and adjust your lifestyle accordingly. For example, if you’re trying to lose weight, you can use the chart to track your progress and stay motivated.
Some key benefits of using a BMI chart include:
- Easy to use and understand
- Provides a quick snapshot of your health status
- Helps you track changes over time
- Can be used by both men and women
BMI Chart for Women: Female-Specific Considerations
Women’s health is intricately linked with their BMI, making it essential to understand its implications. While the basic BMI calculation remains the same for both genders, there are several female-specific factors that influence the interpretation of BMI for women.
Hormonal Influences on Female BMI
Hormonal fluctuations throughout a woman’s life, such as those experienced during the menstrual cycle, pregnancy, and menopause, can affect body weight and composition. For instance, water retention during certain phases of the menstrual cycle can temporarily increase weight. Understanding these hormonal influences is crucial for accurately interpreting BMI.
Pregnancy and BMI Calculations
During pregnancy, BMI calculations become more complex due to the added weight of the fetus, placenta, and increased fluid retention. Healthcare providers often use pre-pregnancy BMI to assess healthy weight gain during pregnancy. It’s essential for pregnant women to consult with their healthcare provider to understand healthy BMI ranges during pregnancy.
Menopause and Weight Distribution
Menopause brings significant hormonal changes that can lead to shifts in body composition, often resulting in increased fat around the abdominal area. This change can increase the risk of health issues, even for women within a normal BMI range. Monitoring waist circumference alongside BMI can provide a more comprehensive picture of health during menopause.
Healthy BMI Ranges for Women
While the standard BMI categories apply to women, some studies suggest that a slightly higher BMI range might be more appropriate for older women due to changes in body composition with age. The following table summarizes the BMI categories and their corresponding health risks for women:
| BMI Category | Health Risk |
|---|---|
| Underweight (<18.5) | High |
| Normal (18.5-24.9) | Low |
| Overweight (25-29.9) | Moderate |
| Obese (>30) | High |
By understanding these female-specific considerations, women can more accurately interpret their BMI and take appropriate steps towards maintaining a healthy weight and reducing health risks.
BMI Chart for Men: Male-Specific Factors
For men, calculating BMI is more than just a number; it’s about understanding their overall health. While BMI is a universal measurement, there are several male-specific factors that can influence the interpretation of BMI charts for men.

Muscle Mass and Male BMI Readings
One crucial factor is muscle mass. Men generally have a higher muscle mass compared to women, which can affect their BMI readings. Athletic men, in particular, may have a high BMI without being overweight because muscle is denser than fat. Therefore, BMI might not always accurately reflect their health status.
Age-Related Changes in Male Body Composition
As men age, their body composition changes. Typically, there’s a decrease in muscle mass and an increase in body fat, especially around the abdominal area. This shift can lead to changes in BMI, and understanding these age-related changes is vital for interpreting BMI correctly.
Optimal BMI Ranges for Men
While the standard BMI categories apply to both men and women, some studies suggest that the optimal BMI range for men might be slightly different. Generally, a BMI between 18.5 and 24.9 is considered normal, but men with a higher muscle mass might be healthy at a slightly higher BMI.
Common BMI Patterns in Men
Men often exhibit different BMI patterns compared to women, partly due to differences in body composition and fat distribution. Understanding these patterns can help in using the men’s BMI chart more effectively for health assessments.
BMI Charts for Different Age Groups
The application of BMI charts differs among children, adults, and seniors due to unique physiological characteristics. As individuals grow and age, their body composition and health risks change, necessitating age-specific BMI interpretations.
Children and Adolescents
For children and adolescents, BMI charts are used in conjunction with growth charts to assess weight status and predict potential health risks. The Centers for Disease Control and Prevention (CDC) provide BMI-for-age charts that take into account the child’s age and sex. These charts help parents and healthcare providers understand whether a child’s weight is in a healthy range for their height and age.
Key considerations for this age group include:
- Growth patterns and developmental stages
- Age- and sex-specific BMI percentiles
- Potential for early intervention in cases of abnormal weight trends
Adults
For adults, BMI is a widely used indicator of whether their weight is in a healthy range for their height. The standard BMI categories (underweight, normal weight, overweight, and obese) apply to adults aged 18-65. However, it’s essential to consider that BMI is not a perfect measure, as it does not differentiate between lean body mass and body fat.
Adults can use BMI charts to track changes in their weight status over time and make informed decisions about their health.
Seniors (65+)
For seniors, BMI interpretations must consider age-related changes in body composition, such as decreased muscle mass and bone density. While the same BMI categories are often used, there’s ongoing debate about whether seniors should have different BMI thresholds due to their different health risks and body composition.
Important factors for seniors include:
- Potential for sarcopenia (loss of muscle mass)
- Impact of chronic health conditions on weight and BMI
- The role of BMI in assessing health risks and functional status
Ethnic and Racial Variations in BMI Interpretation
BMI interpretation can vary significantly across different racial and ethnic populations. While BMI is a widely used metric to assess body weight and health risks, its application can be limited by not considering the diverse body compositions and genetic backgrounds of various ethnic and racial groups.
Asian-Specific BMI Thresholds
For individuals of Asian descent, the BMI thresholds for overweight and obesity are often lower than those for other populations. This is because Asians may have a higher percentage of body fat for a given BMI compared to Caucasians. The World Health Organization (WHO) has proposed lower BMI cut-off points for Asian populations to better reflect their health risks.
African American BMI Considerations
For African Americans, muscle mass and bone density can be higher compared to other ethnic groups, potentially affecting BMI readings. Studies suggest that using the same BMI thresholds as for Caucasians may not accurately reflect health risks for African Americans. Adjustments in BMI interpretation may be necessary to account for these differences.
Hispanic and Other Ethnic Groups
Hispanic populations, as well as other ethnic groups such as Pacific Islanders and Native Americans, also have unique considerations when it comes to BMI interpretation. For instance, Hispanic individuals may have a different distribution of body fat, which can influence their risk for certain health conditions.
| Ethnic Group | BMI Considerations | Health Risks |
|---|---|---|
| Asian | Lower BMI thresholds | Higher risk of diabetes and cardiovascular diseases at lower BMIs |
| African American | Higher muscle mass and bone density | Potential underestimation of health risks if using standard BMI thresholds |
| Hispanic | Different body fat distribution | Increased risk of metabolic syndrome and related conditions |
Health Implications of Different BMI Ranges
Understanding the health implications associated with different BMI categories is crucial for maintaining overall well-being. BMI, or Body Mass Index, is a widely used measurement to assess body fat based on height and weight. It serves as a preliminary indicator of whether a person’s weight is in a healthy range for their height.

Risks Associated with Being Underweight
Being underweight, defined as having a BMI below 18.5, can lead to several health concerns. Individuals with a low BMI may experience fatigue, weakened immunity, and poor wound healing. Moreover, being underweight can also lead to osteoporosis and hair loss due to nutritional deficiencies. It’s essential for underweight individuals to consult healthcare professionals to identify underlying causes and develop a plan to achieve a healthy weight.
Maintaining Health at a Normal Weight
Maintaining a normal BMI, between 18.5 and 24.9, is associated with the lowest risk of chronic diseases. Individuals within this range are less likely to experience diabetes, heart disease, and certain cancers. To maintain a healthy weight, it’s recommended to follow a balanced diet and engage in regular physical activity. Monitoring weight and making adjustments as necessary can help prevent slipping into an unhealthy BMI category.
Early Intervention for Overweight Individuals
For those who are overweight (BMI of 25-29.9), early intervention is key to preventing further weight gain and associated health risks. Being overweight increases the risk of developing hypertension, type 2 diabetes, and cardiovascular disease. Lifestyle changes such as adopting a healthier diet and increasing physical activity can help manage weight. Consulting with a healthcare provider or a nutritionist can provide personalized strategies for weight management.
Health Risks and Management of Obesity
Obesity, categorized by a BMI of 30 or higher, is associated with significant health risks, including increased risk of heart disease, stroke, and certain types of cancer. Managing obesity often requires a comprehensive approach, including dietary changes, increased physical activity, and sometimes medical intervention. It’s crucial for individuals with obesity to work with healthcare professionals to develop a tailored plan to improve their health and reduce the risk of obesity-related complications.
In conclusion, understanding the health implications of different BMI ranges is vital for maintaining a healthy lifestyle. By recognizing the risks associated with being underweight, overweight, or obese, and taking proactive steps, individuals can work towards achieving a healthy BMI and reducing the risk of chronic diseases.
Limitations and Criticisms of BMI
While BMI is a widely used metric, it has several limitations that affect its accuracy for certain individuals. One of the primary concerns is that it does not differentiate between lean body mass and body fat, leading to potential misclassifications.
Athletes and Muscular Individuals
Athletes and individuals with a high muscle mass may have a high BMI without being overweight, as muscle is denser than fat. For instance, a bodybuilder might have a BMI that categorizes them as obese, despite having a very low body fat percentage.
Body Composition Not Considered
BMI calculations are based solely on height and weight, ignoring the composition of the body. This means that individuals with a higher proportion of muscle mass may be classified differently than those with more body fat, even if they have similar health risks.
Height and Body Frame Variations
BMI does not account for variations in body frame or height. Taller individuals may have a higher BMI without being at greater health risk, simply because the formula does not adjust for height appropriately.
Alternative Measurement Methods
Given the limitations of BMI, alternative methods such as waist circumference, body fat percentage, and waist-to-hip ratio have been proposed to provide a more accurate assessment of health risks. These methods can offer a more nuanced view of an individual’s health status.
In conclusion, while BMI is a useful initial screening tool, it is crucial to consider its limitations and potentially supplement it with other measurements for a more comprehensive health assessment.
Beyond BMI: Complementary Measurements
Although BMI is a useful starting point, complementary measurements can provide a more nuanced understanding of overall health. For men, using a BMI chart for men or men’s BMI chart is just the beginning.
Waist Circumference
Waist circumference is a simple yet effective measurement that can indicate health risks associated with excess belly fat. For men, a waist circumference above 40 inches is considered high risk.
Body Fat Percentage
Body fat percentage measures the proportion of body fat compared to lean body mass. This metric can be particularly useful for athletes or individuals with a high muscle mass, as it provides a more accurate picture of health than BMI alone.
Waist-to-Hip Ratio
The waist-to-hip ratio is calculated by dividing the waist circumference by the hip circumference. This measurement can provide insights into body fat distribution and associated health risks.
Body Composition Analysis
Body composition analysis involves measuring the proportions of fat, lean tissue, and bone in the body. This can be done using various methods, including dual-energy X-ray absorptiometry (DXA) scans.
| Measurement | Description | Health Risk Indicator |
|---|---|---|
| Waist Circumference | Measures belly fat | >40 inches for men |
| Body Fat Percentage | Proportion of body fat | Varies by age and sex |
| Waist-to-Hip Ratio | Body fat distribution | >0.9 for men |
| Body Composition Analysis | Proportions of fat, lean tissue, and bone | Varies by method and criteria |
By considering these complementary measurements alongside men bmi chart or bmi chart for men, individuals can gain a more comprehensive understanding of their health and make informed decisions about their well-being.
Using BMI for Weight Management Goals
Effective weight management begins with understanding one’s BMI and how it relates to overall health. BMI, or Body Mass Index, is a simple yet effective tool for determining whether one’s weight is in a healthy range for their height.
Setting Realistic BMI Targets
Setting realistic BMI targets involves understanding the healthy BMI range, which is typically between 18.5 and 24.9. For women, using a BMI chart for women or a female BMI chart can help identify a healthy weight range. It’s essential to consider factors like muscle mass and body composition when setting these targets.
| BMI Category | BMI Range | Health Risks |
|---|---|---|
| Underweight | Less than 18.5 | Malnutrition, Osteoporosis |
| Normal Weight | 18.5 – 24.9 | Low risk |
| Overweight | 25 – 29.9 | Increased risk of chronic diseases |
Tracking Progress Effectively
Tracking progress involves regularly calculating your BMI and monitoring changes over time. Using a women’s BMI chart or a womens BMI chart can help visualize progress. It’s also crucial to combine BMI tracking with other health metrics for a comprehensive view of health.
When to Consult Healthcare Professionals
It’s advisable to consult healthcare professionals when you’re unsure about your BMI or if you’re planning significant changes to your diet or exercise routine. Professionals can provide personalized advice based on your overall health, not just your BMI.
Combining BMI with Other Health Metrics
Combining BMI with other health metrics like waist circumference, blood pressure, and body fat percentage provides a more complete picture of health. This holistic approach helps in setting realistic and healthy weight management goals.
By understanding and effectively using BMI, individuals can make informed decisions about their weight management goals. Regular monitoring and a comprehensive approach to health ensure a more successful and sustainable weight management journey.
Common Myths and Misconceptions About BMI
Despite its widespread use, BMI is often misunderstood, leading to various misconceptions. Body Mass Index (BMI) is a widely used measurement to assess weight status, but its simplicity can lead to misinterpretations. Understanding the common myths surrounding BMI can help individuals make more informed decisions about their health.
BMI as the Ultimate Health Indicator
One of the most significant misconceptions about BMI is that it is the ultimate indicator of health. While BMI can provide a general indication of whether a person’s weight is in a healthy range for their height, it does not directly measure body fat or health. For instance, athletes with high muscle mass may have a high BMI without being overfat. It’s essential to consider other health metrics alongside BMI.
One-Size-Fits-All BMI Standards
Another myth is that BMI standards are universally applicable. However, BMI may not accurately reflect the health status of individuals from different ethnic backgrounds or age groups. For example, older adults may have a different body composition than younger individuals, affecting the interpretation of their BMI. Recognizing these variations is crucial for a more accurate assessment.
BMI and Body Image Concerns
BMI can sometimes contribute to body image concerns, as it categorizes individuals into specific weight categories. This categorization can lead to stigma or pressure to conform to certain body standards. It’s vital to understand that BMI is just one tool among many for assessing health and that a healthy body image encompasses more than just a number on a scale.
Conclusion
Using a or and can be a valuable tool in assessing your weight status and making informed decisions about your health. By understanding your BMI, you can identify potential health risks and take proactive steps to maintain a healthy weight.
Whether you’re using a or , it’s essential to consider your overall health and wellness. BMI is just one aspect of a comprehensive health assessment. By combining BMI with other health metrics, you can gain a more accurate understanding of your health and make positive changes to improve your well-being.
Take control of your health by understanding your BMI and using it as a guide to achieve your weight management goals. With the right information and a proactive approach, you can maintain a healthy weight and reduce the risk of chronic diseases.